Estimated optimization value depends on validation and the human cost reference
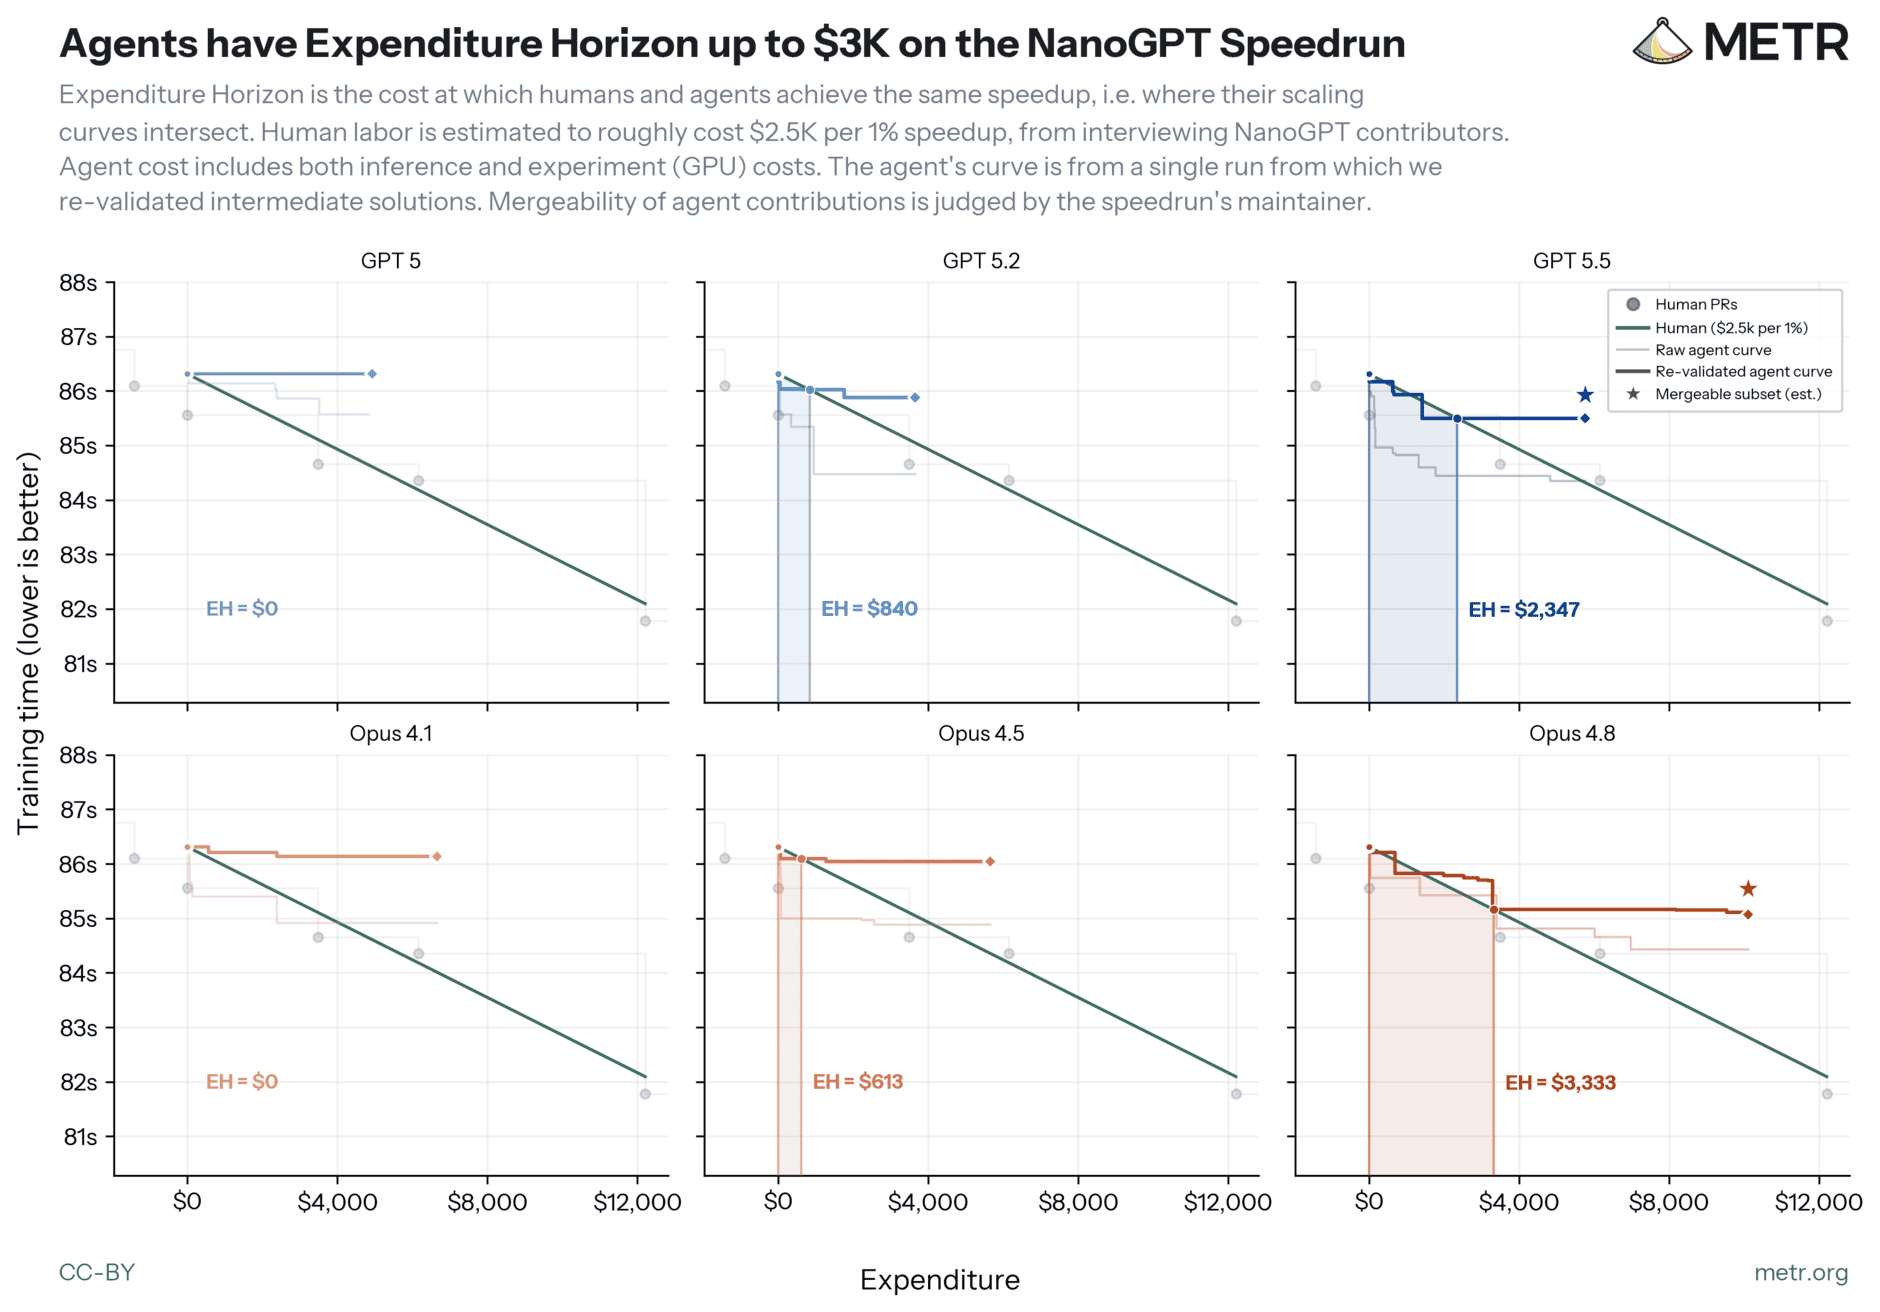
METR reports positive revalidated expenditure horizons for four of six models. Raw trajectories overstate progress; the potentially mergeable share is smaller than the full validated gain.
Each curve is one optimization trajectory from NanoGPT record #78. The horizon is the budget where agent and estimated human improvements match, using about $2,500 of human labor per 1% speedup. Agent cost includes inference and experiments; agents had 32 H100 GPUs across four nodes. Stars mark maintainer estimates, not confirmed merges.
View original chart and methods ↗
Expenditure Horizon: Measuring Optimization Ability, with an Application to NanoGPT · Estimating agent expenditure horizons; expenditure-horizon.png; human-cost sensitivity table
How to interpret this chart
- The human calibration relies on two contributor interviews and speculative effort estimates; it is not a matched human trial.
- The $3,333 and $2,347 figure labels are estimates; the sensitivity table rounds them to $3,300 and $2,300.
- Under $1,000 versus $10,000 per 1% human-cost assumptions, the article reports Opus-4.8 horizons of $120 versus $14,400 and GPT-5.5 horizons of $160 versus $9,400.
- Noise, hardware differences, a partially AI-optimized starting checkpoint and possible contamination limit generalization. Record #12 contaminated runs are excluded from the main analysis.
- Dollar-valued optimization ability is not a direct measure of recursive acceleration or actual economic savings.
Published values from the chart
Exact printed figure labels for the $2,500-per-1%-speedup human reference. Zero is explicitly printed, not substituted for missing data. These are estimated curve intersections, not API bills, human task durations, or a cross-protocol ranking.
| Model label | Expenditure horizon estimate (USD) |
|---|---|
| GPT 5 | 0 |
| GPT 5.2 | 840 |
| GPT 5.5 | 2,347 |
| Opus 4.1 | 0 |
| Opus 4.5 | 613 |
| Opus 4.8 | 3,333 |