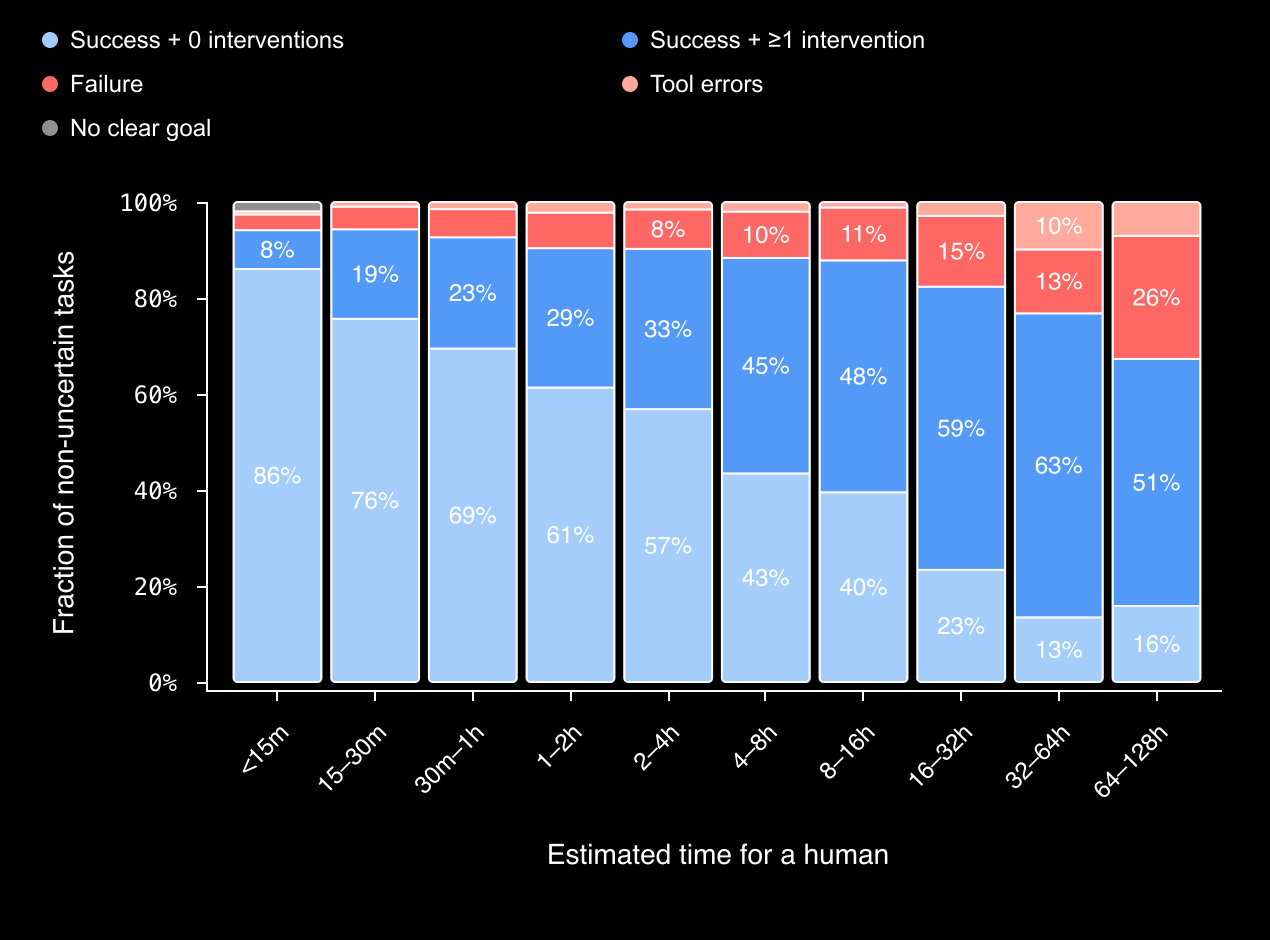
More research tasks completed without intervention
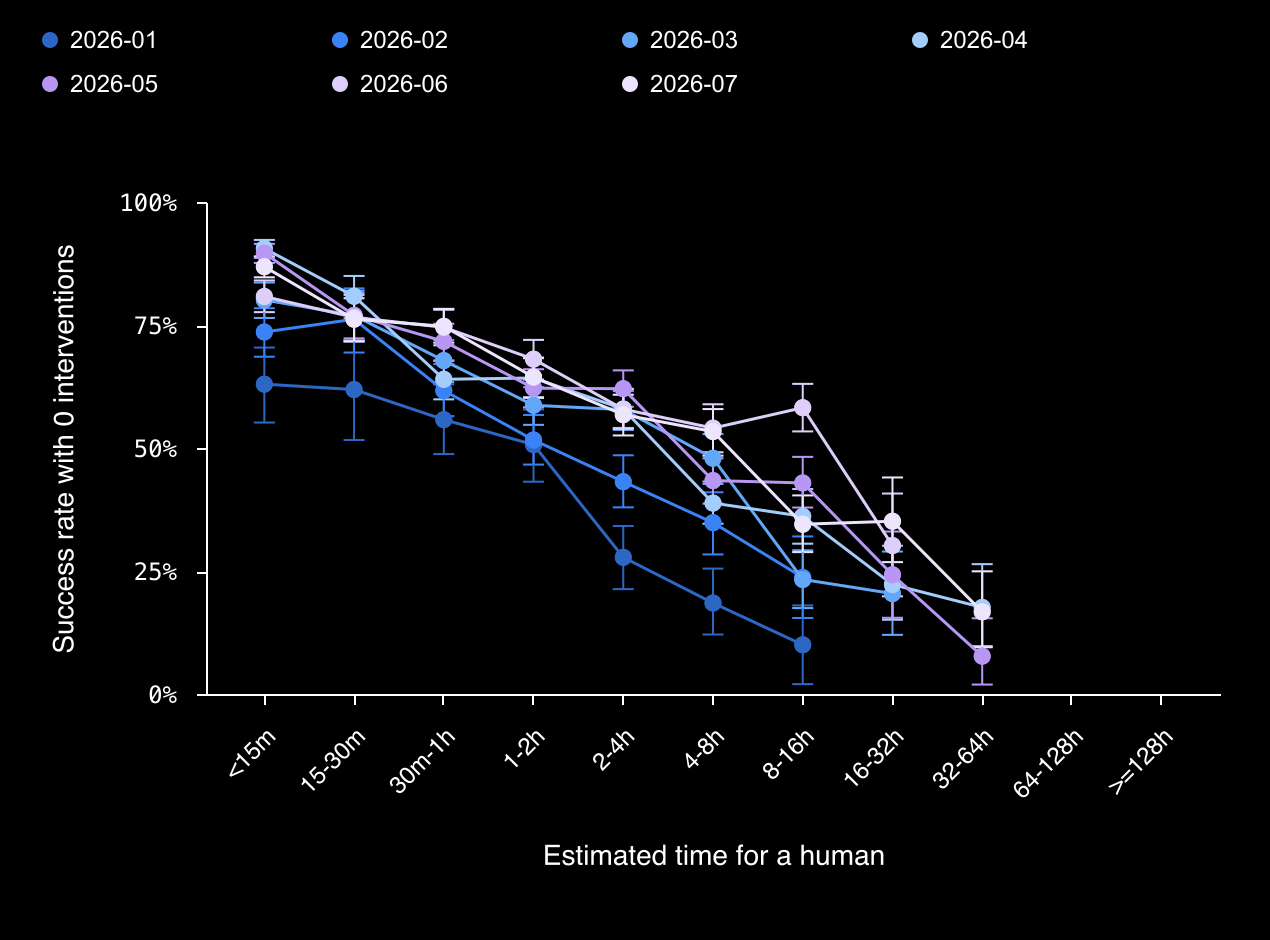
OpenAI reports that success without human intervention generally increased across several task-duration groups from January to July 2026. This shows growing ability to carry out parts of researchers’ work.
OpenAI Research coding-agent sessions, January–July 2026. Time buckets estimate how long a human would need, not how long the agent ran. Results give each user equal weight and exclude uncertain outcomes.
View original chart and methods ↗
Research acceleration: The view inside OpenAI · Section 3, “Agents are increasingly solving more complex tasks for researchers”; View methods
How to interpret this chart
- The result is successful tasks with zero interventions among eligible tasks, not success among only the tasks that received no intervention.
- Outcomes and human-effort estimates were classified by GPT-5.6 Sol; this identifies the evaluator, not the models being evaluated. Human agreement was checked on 25 tasks, without a published accuracy rate.
- Task mix, users, models and software changed over time. Duration grouping only partly controls these differences; this is not a fixed benchmark or a causal measure of research productivity.
- The caption excludes cells with fewer than 50 sessions or 50 users; the accessible description calls these tasks. Each sampled session is assigned one primary task. Late-July sessions lack a full seven-day follow-up.
Published values from the chart
All 57 displayed point labels, at the source’s published precision. Half-widths are copied from accessible labels; missing or suppressed cells are not zero. No unrounded estimates or inferred interval endpoints are supplied.
| Month | Estimated human time | Success without intervention | 95% interval half-width |
|---|---|---|---|
| 2026-01 | <15m | 63% | 7.6% |
| 2026-01 | 15-30m | 62% | 10.1% |
| 2026-01 | 30m-1h | 56% | 7.1% |
| 2026-01 | 1-2h | 51% | 7.3% |
| 2026-01 | 2-4h | 28% | 6.4% |
| 2026-01 | 4-8h | 18% | 6.7% |
| 2026-01 | 8-16h | 10% | 8.0% |
| 2026-02 | <15m | 74% | 4.9% |
| 2026-02 | 15-30m | 76% | 6.5% |
| 2026-02 | 30m-1h | 62% | 5.3% |
| 2026-02 | 1-2h | 52% | 5.0% |
| 2026-02 | 2-4h | 43% | 5.3% |
| 2026-02 | 4-8h | 35% | 6.3% |
| 2026-02 | 8-16h | 24% | 8.3% |
| 2026-03 | <15m | 80% | 3.6% |
| 2026-03 | 15-30m | 77% | 5.1% |
| 2026-03 | 30m-1h | 68% | 4.3% |
| 2026-03 | 1-2h | 59% | 3.8% |
| 2026-03 | 2-4h | 58% | 3.9% |
| 2026-03 | 4-8h | 48% | 5.1% |
| 2026-03 | 8-16h | 23% | 5.9% |
| 2026-03 | 16-32h | 20% | 8.5% |
| 2026-04 | <15m | 91% | 1.8% |
| 2026-04 | 15-30m | 81% | 4.3% |
| 2026-04 | 30m-1h | 64% | 3.9% |
| 2026-04 | 1-2h | 64% | 4.0% |
| 2026-04 | 2-4h | 58% | 3.9% |
| 2026-04 | 4-8h | 39% | 4.3% |
| 2026-04 | 8-16h | 36% | 5.6% |
| 2026-04 | 16-32h | 22% | 7.5% |
| 2026-04 | 32-64h | 18% | 8.3% |
| 2026-05 | <15m | 90% | 1.9% |
| 2026-05 | 15-30m | 77% | 4.6% |
| 2026-05 | 30m-1h | 72% | 3.7% |
| 2026-05 | 1-2h | 62% | 3.9% |
| 2026-05 | 2-4h | 62% | 3.7% |
| 2026-05 | 4-8h | 43% | 4.6% |
| 2026-05 | 8-16h | 43% | 5.2% |
| 2026-05 | 16-32h | 24% | 8.8% |
| 2026-05 | 32-64h | 8% | 6.7% |
| 2026-06 | <15m | 81% | 3.2% |
| 2026-06 | 15-30m | 77% | 4.7% |
| 2026-06 | 30m-1h | 75% | 3.6% |
| 2026-06 | 1-2h | 68% | 4.0% |
| 2026-06 | 2-4h | 58% | 4.1% |
| 2026-06 | 4-8h | 54% | 4.9% |
| 2026-06 | 8-16h | 58% | 4.8% |
| 2026-06 | 16-32h | 30% | 10.4% |
| 2026-07 | <15m | 87% | 2.1% |
| 2026-07 | 15-30m | 76% | 4.4% |
| 2026-07 | 30m-1h | 75% | 3.4% |
| 2026-07 | 1-2h | 64% | 4.0% |
| 2026-07 | 2-4h | 57% | 4.1% |
| 2026-07 | 4-8h | 53% | 4.7% |
| 2026-07 | 8-16h | 35% | 5.8% |
| 2026-07 | 16-32h | 35% | 8.6% |
| 2026-07 | 32-64h | 17% | 7.7% |