preprint · 2026-10-05

TasteVal: Measuring the Experimental Research Taste of AI Systems Against Human Experts

Why it matters here

TasteVal isolates experimental planning from implementation: a Researcher chooses experiments while a fixed Opus 4.8 Coder executes them. Twenty main-cohort models are compared on a nominal suite of eight private AI R&D tasks with six seeds per scored task and references from 24 recruited human experts. Opus 5.5 and Fable 5.1 were scored on seven tasks; one refused task was excluded as missing data, not failure or zero. The other main-cohort models were scored on eight. Compute uses best-of-run reference envelopes, while final performance uses the best human final score per task. Opus 5.5’s reported compute multiplier is 2.30× (95% CI 1.15–4.37); its normalized final-performance multiplier is 1.14× (1.01–1.31). The authors fit a 3.0-month recent doubling time for compute efficiency but 14.6 months for normalized final performance. These are distinct metrics, not a general research-taste or RSI growth rate.

Read original source ↗

AI-R&D capabilityAI-system improvementEvaluation integrity

What the charts show

Compute efficiency improves on fixed research tasks

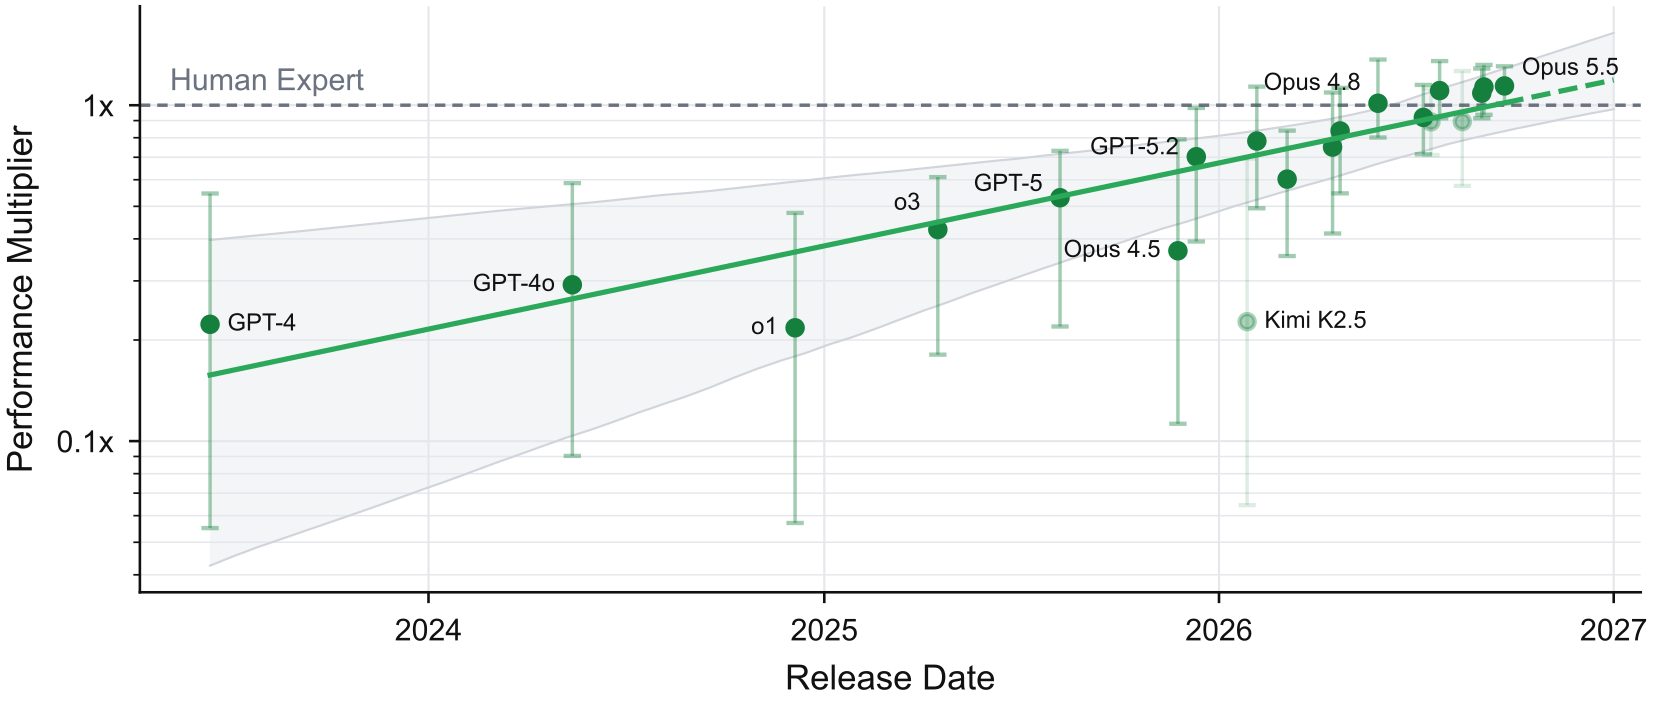
Authors fit a 3.0-month compute-multiplier doubling time after December 2025 (95% CI 1.7–5.0 months).

Horizontal axis: model release date, not evaluation date. Vertical axis: multiplier on a logarithmic scale. Points are model estimates with hierarchical-bootstrap 95% intervals; fitted trends use frontier models. Opus 5.5 and Fable 5.1 were scored on seven tasks; one refused task was excluded as missing data, not failure or zero. The other main-cohort models were scored on eight. Human reference is 1×. Geometric mean over run multipliers within each task, then over evaluated tasks (seven for Opus 5.5 and Fable 5.1; eight for the other main-cohort models), with per-task bridges between GPT-4, human and Opus 5.0 best-of-run reference envelopes. Adjacent-reference ratios are assumed constant across score levels within each task, but may differ across tasks. Bootstrap bridge ratios are re-estimated while reference paths, bridge membership and envelopes stay fixed.
Original green model points, human reference and fitted trend with uncertainty bands.
Original source figure faithfully rasterized from its SVG at 150 dpi. Enlarge chart ↗

View original chart and methods ↗
TasteVal: Measuring the Experimental Research Taste of AI Systems Against Human Experts · Figure 1; Table 2; Sections 2.5 and 3.1; Appendix H

How to interpret this chart
  • Measures experimental planning on fixed problems with fast feedback, not choosing worthwhile problems or general scientific taste.
  • Opus 5.5 and Fable 5.1 were scored on seven tasks; one refused task was excluded as missing data, not failure or zero. The other main-cohort models were scored on eight.
  • Eight private tasks on one H100; transfer to frontier-scale, parallel or open-ended research is unestablished. Tasks are withheld, limiting independent reproduction.
  • Reference data come from 24 recruited experts, at least two per task, not the best researchers worldwide. Compute uses per-task best-of-run envelopes; final performance uses the best recruited human final score per task. Humans and models share the Coder and compute/time budgets; inference and salary costs are not matched.
  • Compute multipliers use chained best-of-run reference envelopes and geometric aggregation; they are not a direct model-versus-human runtime ratio on every task. Bootstrap bridge ratios are re-estimated while reference paths, bridge membership and envelopes stay fixed.
  • The 3.0-month fitted doubling time applies to compute efficiency after December 2025; normalized final performance doubles every 14.6 months without a significant trend break. Neither trend establishes recursive acceleration.
  • Authors found no Invented submissions in their labeled sample; progress mainly involved tuning, composition and moderate adaptation. This is not evidence that models cannot invent in other settings.
Published values from the chart

Exact printed Table 2 values for the 20-model Figure 1/4 cohort. Table rounding can differ from the more precise landing-page tooltip. These are source values, not plot estimates. Opus 5.5 and Fable 5.1 were scored on seven tasks; one refused task was excluded as missing data, not failure or zero. The other main-cohort models were scored on eight. Main Table 2 estimates are retained; the common-seven-task sensitivity estimates are different results.

Compute efficiency improves on fixed research tasks
Model / reasoningReported multiplier95% confidence intervalScored tasks
Opus 5.5 (max)2.30×1.15–4.37×7 (one refused task excluded)
Fable 5.1 (max)1.72×0.75–3.70×7 (one refused task excluded)
GPT-6 Astra (max)1.60×0.77–3.02×8
Opus 5.0 (max)1.29×0.69–2.33×8
Opus 4.8 (max)0.84×0.45–1.78×8
GLM 5.3 (max)0.59×0.33–1.49×8
GPT-5.6 Sol (max)0.59×0.31–1.09×8
Opus 4.7 (max)0.50×0.27–0.95×8
GPT-5.5 (xhigh)0.47×0.24–1.11×8
Kimi K3 (reasoning on)0.45×0.31–0.71×8
Opus 4.6 (max)0.40×0.24–0.85×8
GPT-5.2 (high)0.28×0.16–0.54×8
GPT-5.4 (xhigh)0.21×0.12–0.37×8
Opus 4.5 (24k thinking budget)0.12×0.05–0.24×8
GPT-5 (high)0.12×0.06–0.21×8
Kimi K2.5 (max, 96k output)0.09×0.04–0.19×8
o3 (high)0.08×0.04–0.16×8
o1 (high)0.07×0.03–0.14×8
GPT-4o (gpt-4o-2024-05-13)0.06×0.02–0.23×8
GPT-4 (gpt-4-0613)0.03×0.01–0.08×8

Final performance follows a slower fitted trend

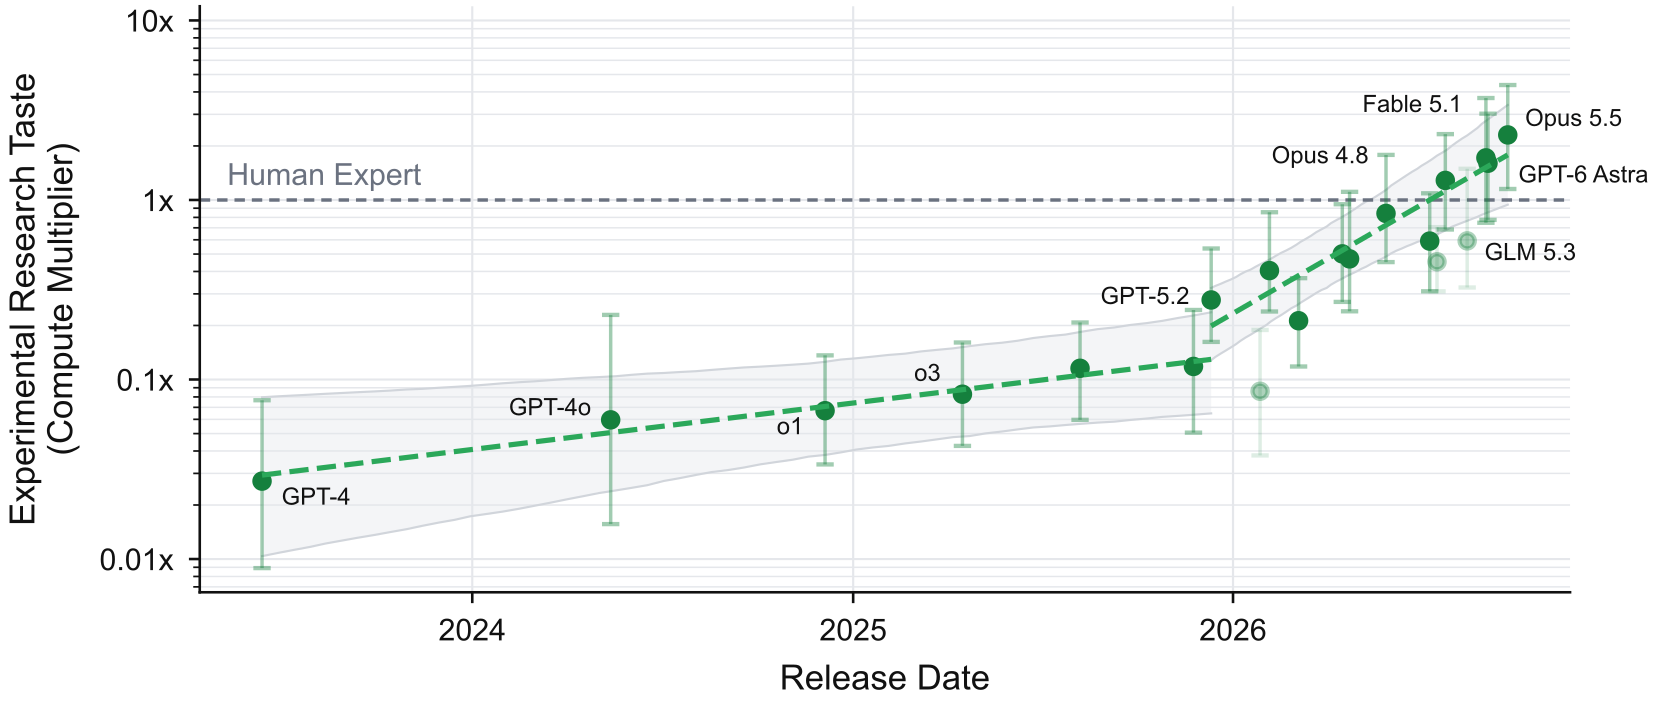
Normalized final performance doubles every 14.6 months in the fitted trend (95% CI 8.4–29.8), with no significant trend break.

Horizontal axis: model release date, not evaluation date. Vertical axis: multiplier on a logarithmic scale. Points are model estimates with hierarchical-bootstrap 95% intervals; fitted trends use frontier models. Opus 5.5 and Fable 5.1 were scored on seven tasks; one refused task was excluded as missing data, not failure or zero. The other main-cohort models were scored on eight. Human reference is 1×. Arithmetic mean of nonnegative normalized final scores across seeds per task, then geometric mean across evaluated tasks; task floor 0.01. Opus 5.5 and Fable 5.1 omit one refused task; this is missing data, not a zero score.

Original green model points, human reference and fitted trend with uncertainty bands.
Original source figure faithfully rasterized from its SVG at 150 dpi. Enlarge chart ↗

View original chart and methods ↗
TasteVal: Measuring the Experimental Research Taste of AI Systems Against Human Experts · Figure 4; Table 2; Sections 2.5 and 3.1; Appendix H

How to interpret this chart
  • Measures experimental planning on fixed problems with fast feedback, not choosing worthwhile problems or general scientific taste.
  • Opus 5.5 and Fable 5.1 were scored on seven tasks; one refused task was excluded as missing data, not failure or zero. The other main-cohort models were scored on eight.
  • Eight private tasks on one H100; transfer to frontier-scale, parallel or open-ended research is unestablished. Tasks are withheld, limiting independent reproduction.
  • Reference data come from 24 recruited experts, at least two per task, not the best researchers worldwide. Compute uses per-task best-of-run envelopes; final performance uses the best recruited human final score per task. Humans and models share the Coder and compute/time budgets; inference and salary costs are not matched.
  • Compute multipliers use chained best-of-run reference envelopes and geometric aggregation; they are not a direct model-versus-human runtime ratio on every task. Bootstrap bridge ratios are re-estimated while reference paths, bridge membership and envelopes stay fixed.
  • The 3.0-month fitted doubling time applies to compute efficiency after December 2025; normalized final performance doubles every 14.6 months without a significant trend break. Neither trend establishes recursive acceleration.
  • Authors found no Invented submissions in their labeled sample; progress mainly involved tuning, composition and moderate adaptation. This is not evidence that models cannot invent in other settings.
Published values from the chart

Exact printed Table 2 values for the 20-model Figure 1/4 cohort. Table rounding can differ from the more precise landing-page tooltip. These are source values, not plot estimates. Opus 5.5 and Fable 5.1 were scored on seven tasks; one refused task was excluded as missing data, not failure or zero. The other main-cohort models were scored on eight. Main Table 2 estimates are retained; the common-seven-task sensitivity estimates are different results.

Final performance follows a slower fitted trend
Model / reasoningReported multiplier95% confidence intervalScored tasks
Opus 5.5 (max)1.14×1.01–1.31×7 (one refused task excluded)
Fable 5.1 (max)1.09×0.91–1.29×7 (one refused task excluded)
GPT-6 Astra (max)1.13×0.94–1.32×8
Opus 5.0 (max)1.11×0.91–1.35×8
Opus 4.8 (max)1.01×0.80–1.37×8
GLM 5.3 (max)0.89×0.58–1.26×8
GPT-5.6 Sol (max)0.92×0.71–1.15×8
Opus 4.7 (max)0.75×0.42–1.09×8
GPT-5.5 (xhigh)0.84×0.55–1.13×8
Kimi K3 (reasoning on)0.89×0.71–1.12×8
Opus 4.6 (max)0.78×0.49–1.14×8
GPT-5.2 (high)0.70×0.39–0.98×8
GPT-5.4 (xhigh)0.60×0.36–0.84×8
Opus 4.5 (24k thinking budget)0.37×0.11–0.79×8
GPT-5 (high)0.53×0.22–0.73×8
Kimi K2.5 (max, 96k output)0.23×0.06–0.69×8
o3 (high)0.43×0.18–0.61×8
o1 (high)0.22×0.06–0.48×8
GPT-4o (gpt-4o-2024-05-13)0.29×0.09–0.59×8
GPT-4 (gpt-4-0613)0.22×0.06–0.55×8

Related benchmarks and indicators

What to keep in mind

  • Measures experimental planning on fixed problems with fast feedback, not choosing worthwhile problems or general scientific taste.
  • Opus 5.5 and Fable 5.1 were scored on seven tasks; one refused task was excluded as missing data, not failure or zero. The other main-cohort models were scored on eight.
  • Eight private tasks on one H100; transfer to frontier-scale, parallel or open-ended research is unestablished. Tasks are withheld, limiting independent reproduction.
  • Reference data come from 24 recruited experts, at least two per task, not the best researchers worldwide. Compute uses per-task best-of-run envelopes; final performance uses the best recruited human final score per task. Humans and models share the Coder and compute/time budgets; inference and salary costs are not matched.
  • Compute multipliers use chained best-of-run reference envelopes and geometric aggregation; they are not a direct model-versus-human runtime ratio on every task. Bootstrap bridge ratios are re-estimated while reference paths, bridge membership and envelopes stay fixed.
  • The 3.0-month fitted doubling time applies to compute efficiency after December 2025; normalized final performance doubles every 14.6 months without a significant trend break. Neither trend establishes recursive acceleration.
  • Authors found no Invented submissions in their labeled sample; progress mainly involved tuning, composition and moderate adaptation. This is not evidence that models cannot invent in other settings.

Related evidence

TasteVal · October 2026 paper v1 · 20-model main cohort2.30×TasteVal · October 2026 paper v1 · 20-model main cohort1.14×TasteVal · October 2026 paper v1 · 20-model main cohort1.72×TasteVal · October 2026 paper v1 · 20-model main cohort1.09×TasteVal · October 2026 paper v1 · 20-model main cohort1.60×TasteVal · October 2026 paper v1 · 20-model main cohort1.13×TasteVal · October 2026 paper v1 · 20-model main cohort1.29×TasteVal · October 2026 paper v1 · 20-model main cohort1.11×TasteVal · October 2026 paper v1 · 20-model main cohort0.84×TasteVal · October 2026 paper v1 · 20-model main cohort1.01×TasteVal · October 2026 paper v1 · 20-model main cohort0.59×TasteVal · October 2026 paper v1 · 20-model main cohort0.89×TasteVal · October 2026 paper v1 · 20-model main cohort0.59×TasteVal · October 2026 paper v1 · 20-model main cohort0.92×TasteVal · October 2026 paper v1 · 20-model main cohort0.50×TasteVal · October 2026 paper v1 · 20-model main cohort0.75×TasteVal · October 2026 paper v1 · 20-model main cohort0.47×TasteVal · October 2026 paper v1 · 20-model main cohort0.84×TasteVal · October 2026 paper v1 · 20-model main cohort0.45×TasteVal · October 2026 paper v1 · 20-model main cohort0.89×TasteVal · October 2026 paper v1 · 20-model main cohort0.40×TasteVal · October 2026 paper v1 · 20-model main cohort0.78×TasteVal · October 2026 paper v1 · 20-model main cohort0.28×TasteVal · October 2026 paper v1 · 20-model main cohort0.70×TasteVal · October 2026 paper v1 · 20-model main cohort0.21×TasteVal · October 2026 paper v1 · 20-model main cohort0.60×TasteVal · October 2026 paper v1 · 20-model main cohort0.12×TasteVal · October 2026 paper v1 · 20-model main cohort0.37×TasteVal · October 2026 paper v1 · 20-model main cohort0.12×TasteVal · October 2026 paper v1 · 20-model main cohort0.53×TasteVal · October 2026 paper v1 · 20-model main cohort0.09×TasteVal · October 2026 paper v1 · 20-model main cohort0.23×TasteVal · October 2026 paper v1 · 20-model main cohort0.08×TasteVal · October 2026 paper v1 · 20-model main cohort0.43×TasteVal · October 2026 paper v1 · 20-model main cohort0.07×TasteVal · October 2026 paper v1 · 20-model main cohort0.22×TasteVal · October 2026 paper v1 · 20-model main cohort0.06×TasteVal · October 2026 paper v1 · 20-model main cohort0.29×TasteVal · October 2026 paper v1 · 20-model main cohort0.03×TasteVal · October 2026 paper v1 · 20-model main cohort0.22×